Optimization
Mt. Baker, WA
Project: Middle Fork Nooksack
Static, Dynamic, and Optimal Reservoir Operations

Reservoir operations match water supplies to water demands. Water supplies and water demands are time variable. Water supplies or reservoir inflows vary from year to year, and supplies and demands follow seasonal cycles.
Demands change as environmental standards change and populations grow.
Water supplies, once thought to be stable, may be changing in total and seasonally due to global warming. Water supplies are usually limited–few reservoirs can meet all demands for water deliveries, in-stream flows, flood protection, etc. at all times.
Schedule Your HFAM Demo.
Dynamic Operations
In static reservoir operation, a rule curve specifies the reservoir contents versus time of year needed to meet project goals. Watershed conditions are not considered.
In dynamic rule curve operations, reservoir operation varies depending on conditions in the watershed. In optimal reservoir operations, current watershed conditions, reservoir storage, and water demands are continuously analyzed to find the current reservoir release.
Engineering practice have utilized dynamic operations for large, economically important reservoirs for many years. A dedicated mainframe was installed in the early 1960’s for use in operating reservoirs in the Columbia River System. To date, practical constraints (e.g. real-time watershed conditions are not observed or modeled) have prevented or limited the scope of dynamic operations for many smaller reservoirs.
Reservoir Operations Timeline
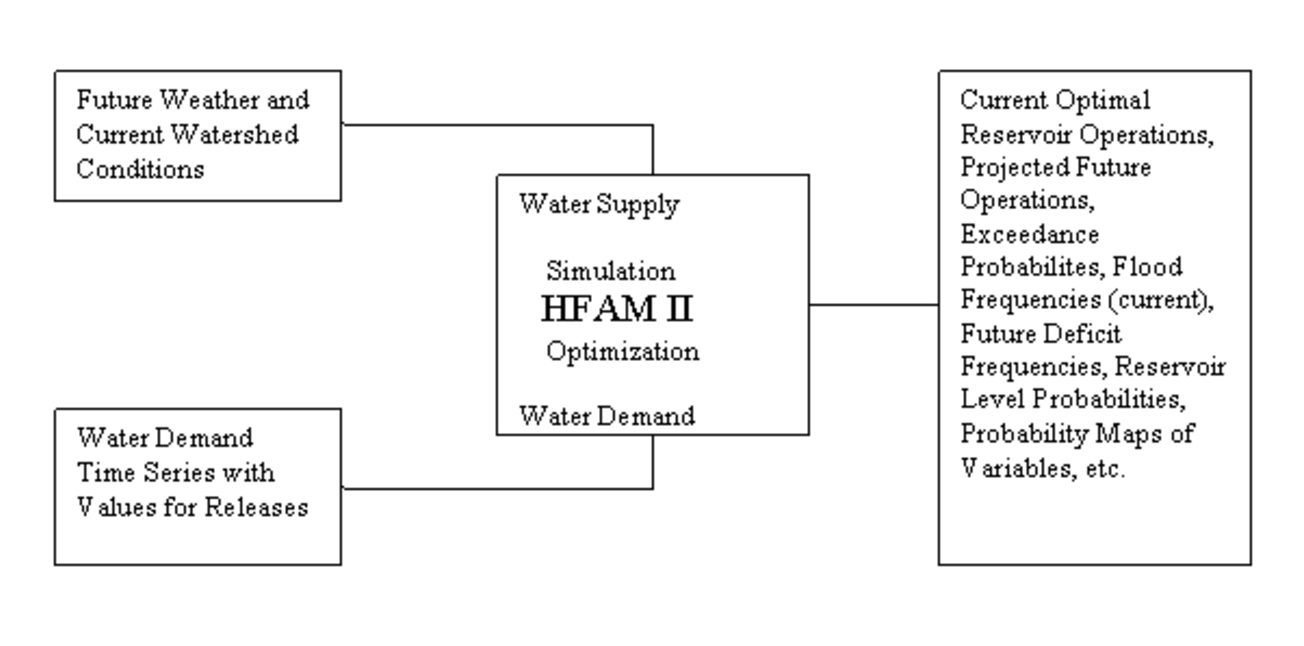
Optimization provides still greater flexibility in reservoir operations, replacing rule curves–including dynamic rule curves. With optimization, detailed information on current watershed conditions is used in models to forecast future water supplies. Values for water are continuously specified and optimal reservoir releases are made. Detailed consequences of reservoir operation can be seen and the overall value of reservoir operations is maximized.
HFAM Optimal Reservoir Operation
Data needed for optimization are values for future reservoir releases and future reservoir inflows. Values for future reservoir releases are sketched in Figure 3
In Figure 3, each color shows demand versus time of year for a release, and each color is assigned a relative value.
Figure 4 is a sketch of relative values at a future date.
Future reservoir inflows are conditioned by the current watershed state. Cumulative reservoir inflow over a future period (up to one year) is shown in the following figure. The red curve in the figure is the result for a selectable weather year. Analysis uses all weather years in the historical database.
Information from Figures 3, 4 and 5 are combined with the current reservoir storage and characteristics (storage elevation curves, reservoir capacity and minimum pool) to find the optimal value of release at the present time, Figure 6.
This analysis is repeated continuously and reservoir releases remain optimal as time advances.


